23 Nov 2016

52 days of geocaching

This post will be different than others - it won't be technical. Recently I reached first milestone (100 caches) and I thought it would be good idea to spread the word about geocaching and show some caches that I found.

I always loved to solve riddles and puzzles. I think this was one of the things that pushed me on subject of security. This was probably also why 2 months ago I took interest in geocaching. I had heard the term before once or twice but only then checked what it was about.

What is geocaching?

Geocaching is an outdoor game, in which participants try to find containters (caches) hidden all around the world. Some of them (traditional caches) require you only to check GPS coordinates and look around to find it. Others (mystery and multicaches) will require solving puzzles or gathering information about a given place or subject. All you need to start your geocaching adventure is smartphone with an app (I recommend c:geo for Android) or gps receiver and geocaches list (largest site is geocaching.com). Now you just need to go to given coordinates (or calculate them from puzzle) and look for a cache. It is easier said than done, believe me. Some of the caches are so well hidden that you will go to coordinates, search the place for half an hour and leave with nothing. After you find it, you can write your name in logbook and trade some stuff which may be inside the cache.


Geocaching is a great way to visit new places (even close to your home) that you wouldn't visit otherwise. You can also learn a lot about people, places and their history. I think it is really cool combination of outdoor game and puzzle solving. It's also quite funny when I see muggle (people who don't know about geocaching) who happened to spot me while looking for a cache. You can clearly see that they are wondering why are you looking inside bushes.


And yes, sometimes they come and ask what am I doing. One more thing that always makes me smile is when I see someone with phone examining trees or fences. You instantly know that they are here to find geocache.

There is more to it though. You can, for example, send trackable items to other places via geocaches. You place item in one cache and give it destination. Other players will move it from one cache to another until it reaches its destination. I have sent Octopus Traveller which tries to visit as many capital cities as possible.


An unexpected journey

My adventure with geocaching began on 23 Sep 2016. I decided to take longer way home and get my first cache. It took me 10-15 minutes to find it.


I thought it was fun and after few more caches I introduced 2 of my friend to geocaching. Quite often we go caching together but sometimes even 3 people are not enough to find a cache or solve a puzzle. Even though I don't always find caches on my first try, it is very rewarding when you finally get it. So far the most difficult cache that I found was CT32 Ordynacka. I needed 3 attempts to find it but I have a feeling that there will be caches where I will need more than that. And that's just finding cache where I knew coordinates. It gets even more difficult when you need to solve a puzzle. I love riddles. I solved many logic and cryptographic puzzles before (for example on BrainQuest or WeChall) but I still can't get my head around some riddles from mystery caches.

One more thing I would like to note is my first STF (Second to find) which I got from fantastic cache "Rezystory". To find it you need to find a circuit and do some measurements and calculations.


I calculated coordinates of the cache and went to get it. Here I got my first STF certificate. I hope to get FTF as soon as possible though.


Caches

To give you idea how they look like, here are some of the caches I have found so far.

It may be a film container hidden on a tree

Some are big and bright...

...others are very small

Hidden very low...

...or quite high

It can be anything from "electric box"...

...to a rock


Hiding in every corner


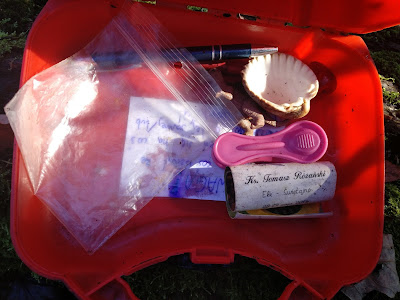
Containing interesting stuff


Milestone

After 52 days I have finally reached the milestone of finding 100 caches. This made me eligible to get first PTTK badge.

At the time of writing this post I have 132 caches found. If you are registered, you can find my profile here: Thun0
And if you are interested, register at geocaching.com

5 Aug 2016

On the subject of debuggers and tracers

Every programmer knows how important and useful debuggers are. They let us examine program memory and execution flow which is very helpful in finding bugs. And if you ever wanted to analyse what some program is doing (maybe in CTF/wargame) you probably know about strace or ltrace. In this post I will explain briefly how they work and create simple tracer as an example.

PTRACE

First we need to know how operating system allows one process to manipulate other processes.

From man:
long ptrace(enum __ptrace_request request, pid_t pid, void *addr, void *data);

The ptrace() system call provides a means by which one process (the "tracer") may 
observe and control the execution of another process (the "tracee"), and examine 
and change the tracee's memory and registers. It is primarily used to implement 
breakpoint debugging and system call tracing.

Ptrace makes it possible to attach to other process, read/write its memory and get notifications when tracee raises signals or makes syscalls. You choose which one by setting proper request in first argument. Knowing this let's try creating our own tracer.

Simple tracer

Our tracer will get path to binary (ELF) as argument and will output functions called by traced program. It will only be able to trace binary with symbols (not stripped) built for x64 architecture to keep it simple.

First thing tracer has to fork, call ptrace with PTRACE_TRACEME request in child process and execute program which we want to trace:
child_pid = fork();
if(child_pid == 0) // child process
{
    ptrace(PTRACE_TRACEME, 0, NULL, NULL);
    execl(argv[1], argv[1], NULL);
    printf("Failed to execl!!\n");
    exit(-1);
}
Parent process will wait for child to call TRACEME and prepare breakpoints. After that it will start tracing.
wait(NULL);
prepare_breakpoints();
trace();
To see which functions were called by tracee we need to know adresses of those functions and insert breakpoint at the beginning of each function. To get this information tracer will obtain symbols table from the elf file.
void prepare_breakpoints()
{
    parse_elf_file();
    insert_brakepoints();
}
I won't make detailed explanation about elf files here as it would take whole another post (which I may write if there is interest). For more info you can check man elf(5) or this description. I included "elf.h" to use elf structures for easier parsing.
void parse_elf_file()
{
    Elf64_Ehdr elf_header;
    Elf64_Shdr section_header;
    fp = fopen(filename, "r");
    if(!fp)
    {
        printf("Failed to open ELF file!\n");
        exit(-1);
    }
    
    fread(&elf_header, 1, sizeof(elf_header), fp);  // read elf header

    fseek(fp, elf_header.e_shoff, SEEK_SET);    // skip to section headers

    for(int i = 0; i < elf_header.e_shnum; ++i) // iterate through headers
    {
        fread(&section_header, 1, sizeof(section_header), fp);  // read section header
        if(section_header.sh_type == SHT_SYMTAB)    // check if this section is symbol table
        {
            
            Elf64_Shdr strtab_header;   // we need to get strtab associated with this symtab to get functions names
            long strtab_hdr_offset = elf_header.e_shoff+section_header.sh_link*sizeof(section_header); // calculate offset to strtab header
            fseek(fp, strtab_hdr_offset, SEEK_SET);
            fread(&strtab_header, 1, sizeof(strtab_header), fp);    // read strtab header
            fseek(fp, section_header.sh_offset, SEEK_SET);

            int entries = section_header.sh_size / section_header.sh_entsize;
            breakpoints = malloc(entries*sizeof(Breakpoint));   // there are more entries than just functions

            for(i = 0; i < entries; ++i)
            {
                Elf64_Sym symbol;
                fread(&symbol, 1, sizeof(symbol), fp);          // read symbol
                if(ELF64_ST_TYPE(symbol.st_info) == STT_FUNC    // symbol is a function
                    && symbol.st_name != 0                      // symbol has name
                    && symbol.st_value != 0)                    // symbol has address within binary
                {
                    
                    long pos = ftell(fp);
                    fseek(fp, strtab_header.sh_offset+symbol.st_name, SEEK_SET);

                    breakpoints[bp_count].addr = symbol.st_value;   // get address to beginning of function
                    fread(breakpoints[bp_count].name, SYMBOL_NAME_LEN, sizeof(char), fp);   // get function name

                    fseek(fp, pos, SEEK_SET);
                    bp_count++;
                }
            }
        }
    }
}
Here is how breakpoint structure looks like:
typedef struct 
{
    long addr;
    long original_code;
    char name[SYMBOL_NAME_LEN+1];
} Breakpoint;
Now we need to change first instruction of each function to breakpoint:
void insert_brakepoints()
{
    for(int i = 0; i < bp_count; ++i)
    {
        breakpoints[i].original_code = ptrace(PTRACE_PEEKTEXT, child_pid, (void*)breakpoints[i].addr, 0);
        ptrace(PTRACE_POKETEXT, child_pid, (void*)breakpoints[i].addr, (breakpoints[i].original_code & BKPT_MASK) | BKPT); // insert breakpoint
    }
}
We are ready to continue child process and wait for breakpoint:
void trace()
{
    int status;
    ptrace(PTRACE_CONT, child_pid, 0, 0);   // start child process
    printf("Tracing started\n");
    while(1)
    {
        waitpid(child_pid, &status, 0);     // wait for change of status

        if(WIFEXITED(status))
        {
            printf("Child finished\n");
            return;
        }

        if(WIFSTOPPED(status))  // child stopped
        {
            if(WSTOPSIG(status) == SIGTRAP) // child stopped on sigtrap
            {
               ...
Tracee signaled SIGTRAP which probably is our breakpoint. We need to get RIP register value. If RIP-1 is equal to address of one of our breakpoints then we know that tracee called function which we trace. Why RIP-1? RIP points to next instruction and breakpoint is 1 byte long in opcode.
                ...

                struct user_regs_struct regs;
                ptrace(PTRACE_GETREGS, child_pid, 0, &regs);
                int id = get_bp_id(regs.rip-1); // -1 because rip is now set to next inst and BP is 1 byte
                if(id == -1)
                {
                    printf("Unexpected SIGTRAP %llx\n", regs.rip);
                    return;
                }           
After identifying stepping on breakpoint we have to insert original code in that place, set RIP back to that address (decrement it), single-step over this instruction and set breakpoint back. Then we can continue.
                ...

                else
                {
                    printf("%s();\n", breakpoints[id].name);
                    regs.rip = breakpoints[id].addr;
                    ptrace(PTRACE_SETREGS, child_pid, 0, &regs);    // set rip back to good position
                    ptrace(PTRACE_POKETEXT, child_pid, (void*)breakpoints[id].addr, breakpoints[id].original_code); // return original instruction
                    ptrace(PTRACE_SINGLESTEP, child_pid, 0, 0);     // step instruction
                    wait(NULL); // wait for singlestep
                    ptrace(PTRACE_POKETEXT, child_pid, (void*)breakpoints[id].addr, (breakpoints[id].original_code & BKPT_MASK) | BKPT); // insert breakpoint again
                } 
            }
        ptrace(PTRACE_CONT, child_pid, 0, 0);
    } // end of while loop
} // end of trace()      
You can get code HERE

Testing tracer

Here is small program which I will trace:
                
#include <stdio.h>

int func1()
{
    printf("A");
}

void func2()
{
    printf("B");
}

void func3()
{
}

int main()
{
    func1();
    func3();
    func2();
    func2();
    func3();
    return 0;
}          
Let's run it:
    
thun@avaritia:~/workspace/tracer$ ./tracer test 
PID 6960
Tracing started
===

_start();
__libc_csu_init();
_init();
frame_dummy();
register_tm_clones();
main();
func1();
func3();
func2();
func2();
func3();
__do_global_dtors_aux();
deregister_tm_clones();
_fini();
ABBChild finished
Looks correct! "ABB" before "Child finished" message is output from tracee.

Making next step

I wanted to keep this example simple to give you idea of how it works but you can make much more with it.
First of all, this tracer will show nested function execution the same way as if two functions were called one after another.
You can fix that by adding a bit of code in part when breakpoint is processed:
    - Get RSP register value.
    - Use PTRACE_PEEKTEXT to get function return address from stack (RSP).
    - Set breakpoint on return address.

Secondly, you can not only trace program which you launch but also attach to already running processes by using PTRACE_ATTACH.

You can also get function arguments by reading registers and stack memory when tracee steps on breakpoint at function beggining and read return value at breakpoint on return address.

If you manage to do these steps and set breakpoints on functions in libraries then you have your own ltrace.

Debuggers are based on same idea. Just give user way to interact with tracing process (set breakpoints, read registers etc.).

One more thing. Since Lollipop (5.0), Android uses ART. All apps are compiled but bytecode is also in use (giving much information). By parsing oat files you can get information about function names, parameters and addresses. So if you ever wanted to analyse execution of Pokemon Go (or other android app) now you know how to create trace tool for that.

NOTE: If you want to set breakpoints in attached mode you will need to adjust addresses to function by getting base address of binary or library from process maps and adding it to symbol address. Also remember that mapping changes due to ASLR so you cannot hardcode it.